Body Composition Assessment
Introduction
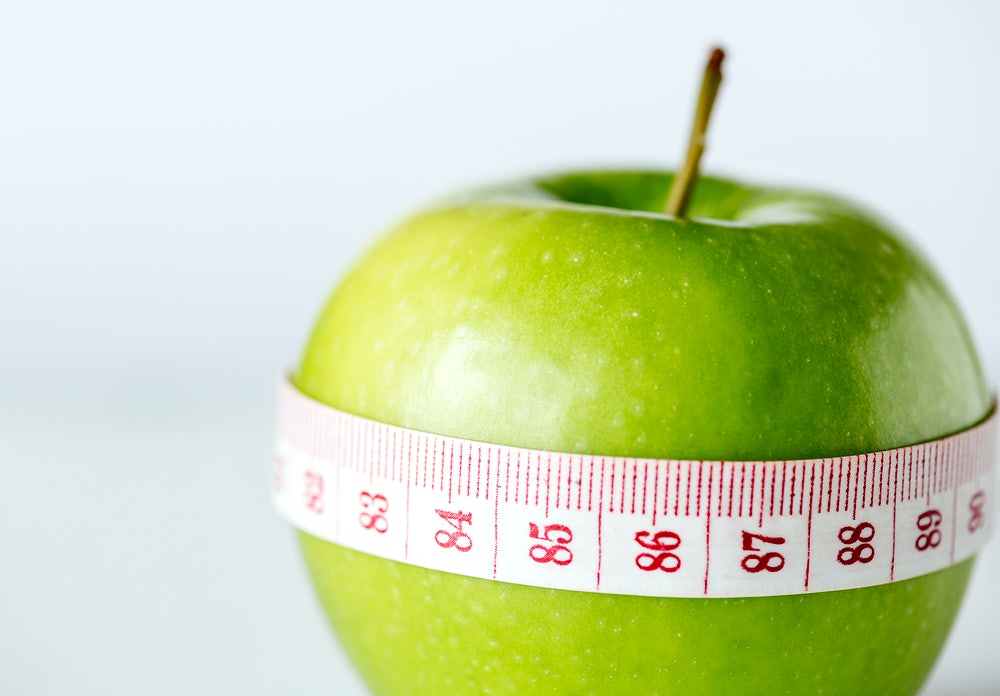
Body composition refers to the relative percent of body weight that is fat mass and fat-free mass. Fat-free mass is composed of the skeleton, water, muscle, connective tissue, organ tissue, and teeth. Fat mass is composed of essential fat: the fat that is in one’s blood, that provides a sheath around neurons and other cells, and that is incorporated into organs and tissues; and non-essential fat: mainly adipose tissue that is stored subcutaneously or that surrounds the organs of the body. The latter of the two referred to as visceral fat, is considered more dangerous, as it is more metabolically active and exerts systemic endocrine effects on the body. Therefore, using body composition analysis can be an instrumental tool in determining a subject’s risk for diseases such as cancer, type 2 diabetes, cardiovascular disease, and a multitude of other health complications.
The general recommendations for ideal body composition according to the American College of Sports Medicine in 2018 are 16-25% body fat for women and below 20% body fat for men. While there are several ways to analyze body fat that range from as simple as Body Mass Index (BMI) and hip-to-waist ratios, there are more complex methods such as bioelectrical impedance analyses (BIA) and hydrostatic weighing that have greater reliability across a wider range of populations. Body Mass Indexes are generally more reliable in detecting disease risk in populations who tend to be visibly overweight and have poor body composition. This analysis measures the height to weight ratio of a subject and determines if they are in a normative range (18.5-24.9). This test becomes less reliable when measuring athletes and subjects who have a lot of muscle mass.
Because muscle has a higher density than fat, the BMI analysis of athletes and weightlifters can have skewed readings, flagging them for having a higher risk of disease even when they are relatively lean and have an elite level of cardiorespiratory fitness. For example, Zion Williamson, the highest touted college basketball recruit and prospective number one overall pick for the NBA, who stands at 6 feet 7 inches tall, 285 pounds has a BMI of 32, which is considered obese. Even though he is in stellar physical shape, extremely athletic, and agile, this test may classify him in the same category as a sedentary individual who has little to no exercise experience and engages in poor lifestyle habits that may contribute to their body composition, such as consuming a nutrient-deficient diet, alcohol consumption, and smoking (Centers for Disease Control and Prevention, 2004).
Determining which tests to utilize is the first step in ensuring the data collection is suited properly to the populations being observed, taking into account safety and logistical issues. While BMI analyses may be valuable when assessing large groups of people as a preliminary screening, seeing that one-dimensional tests like the BMI analysis can be unreliable for special populations and don’t necessarily identify what they aim to observe and report. This illustrates the importance of employing multi-variable experiments that can more accurately and precisely collect valuable data in order to classify subjects of a sample or population within proper parameters. Tests such as DEXA scans and hydrostatic weighing can more accurately measure body composition because of their ability to perform more intricate operations and employ more complex mathematics such as regression equations to draw conclusions about a given data set.
The three tests that will be used to measure and analyze body composition are: skinfold measurements, bioelectrical impedance analysis, and hydrostatic weighing. Under ideal circumstances, using the gold standard DEXA (Dual-Energy X-Ray Absorptiometry) scan would yield the most accurate and precise results. However, this requires access to a piece of machinery that is currently not available to the University of Miami, as it is quite expensive and requires professional X-Ray technician operation. Therefore, for the purpose of these experiments, the three aforementioned tests will be employed.
Of the previously listed techniques to measure and analyze body composition, skinfold measurements are the easiest and least expensive. The ideology behind skinfold measurements is that the amount of subcutaneous fat is proportional to the amount of total body fat. Once skinfold measurements are obtained, regression equations are used to convert the sum of skinfolds to a percentage of body fat. Other variables that account for total body fat percentage include gender, age, and ethnicity, therefore it is important to take into account the proper coefficients when performing the regression equation. The accuracy of prediction for skinfolds is + 3.4-3.9%.
The methodology of this technique involves using a set of calipers to measure the thickness of an area of skin around seven different regions: triceps, midaxillary, chest, subscapular, suprailiac, abdominal, and thigh. Taking the average of the measurements of these various sites allows the observer to estimate total body fat percentage as well as analyze fat distribution. This is important, as some people tend to store more fat in certain regions of their body compared to others. While this test is considered the easiest to perform, there is still room for error during experimentation. The testing requires some degree of familiarity, as the person pinching the subject’s skin must follow a specific protocol to ensure there is some uniformity between the skinfolds at different locations, as well as ensure the placement of the calipers are placed in the correct position. This test is cheap, relatively quick to complete, and is reliable across a wide range of populations.
However, this test diminishes in reliability when measuring subjects who are either very lean or very obese. For those who are extremely lean, having knowledge of one’s body fat percentage is realistically only beneficial for bodybuilders or ultra-athletes looking to gain any slight edge over their competitors. As for extremely obese subjects, the test will not necessarily tell them anything that they previously did not know. Those who are morbidly obese should follow an exercise protocol to reduce their risk of all cause mortality before placing any emphasis on the number value of body fat percentage.
Another technique to measure body composition is the use of Bioelectrical Impedance Analysis (BIA), which measures resistance to flow across tissues. In BIA, a weak imperceptible electrical current is run through the body. Muscles, blood vessels, and bones are body tissues which contain high water content that conduct electricity easily. Body fat has little water, and therefore is a poor conductor of electricity with high impedance to the electrical signal. This is the same reason why fat is a good insulator.
When the body fat analyzer sends an electrical current through the body, it can measure the amount of impedance, or resistance to flow. The greater the amount of fat tissue a person has, the greater the resistance they will have to the flow of the current. The greater muscle mass and density a person has, the easier the current will flow through the body. The body fat analyzer uses a formula that is based on five factors to determine body fat percentage: electric resistance, height, weight, age, and gender. There are three types of body fat analyzers that were used to analyze the subjects: the Omron handheld analyzer, the Tanita platform leg-to-leg analyzer, and the Inbody dual-frequency total body composition analyzer.
The Omron and Tanita analyzers are slightly less reliable than the Inbody, as they only measure the impedance between two sites, whereas the Inbody analyzer measures hand-to-foot across both sides of the body. This allows for the Inbody to more accurately report body composition across a greater cross-sectional area that is more representative of total body fat percentage values. There are limitations for this method, as some factors may interfere with the devices, such as room temperature, placement of electrodes, subject’s hydration status, and general preparation of the skin for the test. BIA is best done when the subject is in a rested, well-hydrated state and properly following additional protocols for maximum accuracy.
Prior to the advent of the DEXA scan, the gold standard for determining body composition has been the technique of underwater weighing or hydrostatic weighing. This method is based on Archimede’s principle, which states that when an object – in this case a human body – is immersed in water, it is buoyed by a counterforce equal to the weight of water displaced. The loss of weight in water, corrected for the density of water, allows body volume calculation. Using body density to extrapolate body composition allows this technique to distinguish between two people who may weigh the same in air, but due to variances in body density, may have different weights when submerged underwater.
As previously mentioned, the muscle has a greater density than fat, therefore a person with more muscle mass will sink more easily, and a person with a higher percentage of body fat will be more buoyed. Lean mass is the densest variable in this experiment, followed by water, then fat, then air. Body fat percentages from underwater weighing are obtained by measuring body volume and converting to body density, using the ratio of body mass to body volume, then converting body density to body fat. Body density using hydrostatic weighing can be calculated using the following equation:
The density of water can be approximated as 1 g/mL, but for the sake of the experiment will be corrected for water temperature, resulting in a density below 1.0. As the water rises in temperature, it expands and increases volume, thereby reducing the volume and increasing the density of a subject in the tank. Therefore, correcting for water temperature will yield a better reading. As noted in the above equation, another element of hydrostatic weighing involves the calculation of the residual volume. Residual volume (RV) is the amount of air in a person’s lungs after completely exhaling. It is the air in the lungs that cannot be exhaled – roughly 20-25% of total lung capacity, and can also be calculated as a sex-specific percentage of Forced Vital Capacity (FVC): FVC * 0.24 for males and FVC * 0.28 for females.
This must be accounted for when calculating body density, and proper protocol must be followed in order to yield correct readings. For example, if one does not completely expel the air from their lungs, the more buoyant and less dense they will be. This will artificially inflate their estimated body fat by lowering body density. Therefore, a major limitation to this study is a subject’s inability to expel all the air from their lungs and remain still under the water for at least 3 seconds – or long enough for the computer to give a steady reading. Submersion of the subject’s head underwater may be difficult and/or anxiety-provoking. This is why multiple readings are taken and generally the more practice and familiarity a subject has, the better the reading is. It is also important to eliminate any air bubbles trapped in the hair or clothes of a subject to reduce excessive air volume that would artificially inflate their estimated body fat.
Another source of error in this method is in the equations themselves. The equations assume a fat mass density equal to 0.900 g/mL and a fat-free mass density equal to 1.100 g/mL. However, the density of fat-free mass is not constant and varies within individuals leading to an error of the estimate of + 2%. Second, the prediction of residual volume from FVC introduces large error in body density calculation. Third, underwater weight is more accurate using a force-transducer system versus a spring-loaded autopsy scale. Lastly, underwater weighing is expensive, requires special equipment, and is a complicated and time-consuming procedure.
I expect the BIA using the Inbody machine to have the most accurate results when compared to the current leading method of determining body composition that our university has access to – the Hydrostatic Weighing test. Therefore, each method of testing will be compared to the values and other pertinent data given by the Hydrostatic Weighing experiment. The mean, standard deviation, variance, R-value, R2 value, and p-value will be analyzed and compared to determine which method has the greatest reliability. Having an accurate measure of one’s body composition gives people knowledge about their risk of disease. Establishing this baseline is extremely helpful in targeting the sources of these health complications to better prevent the onset of disease. Identifying a problem is the first step for exercise physiologists to prescribe an exercise and lifestyle protocol for those at risk.
Materials and Methods
The subjects of the study (N=8) were both male (N=3) and female (N=5). All measurements of fat distribution as well as measures of body composition of the subjects in the study were obtained in a classroom laboratory setting. The average age of the subjects was 22.5 years old. The average height of the subjects was 67 cm. The average weight of the subjects was 64.24 kg.
The average BMI of the subjects was 21.95 kg/m2. BMI is defined as the body mass divided by the square of the body height. As stated before, BMI does not directly measure body fat, but rather serves as an indication if someone may be overweight. BMI does correlate to body fat somewhat, but as mentioned before, a subject with high muscle mass and low body fat may appear to be obese due to the simplicity of the mathematics involved.
The average waist circumference of the subjects was 28.35 inches or 72.01 cm. Waist circumference can be used to evaluate central obesity. Individuals are considered having higher risk for developing cardiovascular and metabolic diseases if they have a waist circumference greater than 40 inches for males and 35 inches for females.
The average waist to hip ratio of the subjects was 0.77. The waist to hip ratio yields an estimation of body fat patterns by evaluating body fat distribution. Males with a ratio greater than 0.95 and females with a ratio greater than 0.80 have a significant health risk for the development of the cardiovascular disease. A disadvantage of the waist to hip ratio is that it adds another measurement, hips, which can introduce an additional source of error. If someone has a high waist circumference but an even higher hip circumference, it will yield a lower waist to hip ratio, which can obscure a higher absolute waist circumference and higher risk.
The average sagittal abdominal diameter of the subjects was 12.84 cm. Sagittal abdominal diameter is the distance between the back surface and the top of the abdomen midway between the lower rib margin and the superior anterior iliac crest, measured with an anthropometer after a gentle expiration by the subject in a standing position. It is a more accurate measure of visceral adipose tissue and cardiometabolic risk factors (Kahn, H.S., et al., 2014). Calculating this as a ratio with height may provide more information regarding metabolic risk.
Skinfold Measurements Protocol
The instrument used to measure the thickness of the skinfolds was a set of calipers. Each measurement was taken on the right side of the body. The calipers were placed 1 cm away from the thumb and finger, perpendicular to the skinfold, and halfway between the crest and the base of the fold. A source of error when collecting skinfold measurements could be using different hand positions when collecting the measurement, placing the calipers in different positions along the fold, and not pinching and rolling the skin hard enough – the goal is to measure the thickness of the skin and subcutaneous fat, not of fascia and/or muscle tissue. Each of the seven sites were measured twice, rotating through measurement sites as to allow the skin to regain normal texture and thickness before repeating the measurement. A measuring tape and pen were used to mark the midway points of bony landmarks to ensure the repeated measurement was in the same spot.
The average of the two samples of each site was collected and recorded.
- The abdominal skinfold is taken as a vertical fold, 2 cm to the right of the umbilicus.
- Triceps skinfold is taken as a vertical fold on the posterior midline of the upper right arm, halfway between the acromion and olecranon processes.
- Chest/pectoral skinfold is taken as a diagonal fold, halfway between the anterior axillary line and the nipple for men, and one-third the distance between the anterior axillary line and nipple for women.
- Midaxillary skinfold is taken as a vertical fold on the midaxillary line at the level of the xiphoid process of the sternum.
- Subscapular skinfold is taken as a diagonal fold at a 45-degree angle, 1-2 cm below the inferior angle of the scapula.
- Suprailiac skinfold is taken as a diagonal fold, in line with the natural angle of the iliac crest taken in the anterior axillary line immediately superior to the iliac crest.
- Thigh skinfold is taken as a vertical fold on the anterior midline of the thigh, midway between the proximal border of the patella and the inguinal crease.
- Once each site was measured twice, the averages were summed and entered into the following equations:
The values for body densities were then entered into the equation in the lab manual to determine body fat percentage based on proper ethnicity, age, and gender. For example, the body fat percentage of a 22-year-old Caucasian male with a body density of 1.08339758 g/mL would be:
Bioelectrical Impedance Analysis Protocol
There were three instruments used to measure bioelectrical impedance: an Omron HBF-306C handheld body fat analyzer, a Tanita BF-522 platform body fat analyzer, and an Inbody 270 body composition analyzer. The Omron handheld device required the input of height, weight, sex, and age. Once the subject placed their hands on the grip without wrapping thumbs around/behind grip handles, they held the device for 5 seconds, then their results were displayed on the screen. The Tanita scale also required the subject to input data for height, weight, sex, and age. Once the subject stood on the scale for 5 seconds, their results were displayed on the screen.
For the Inbody machine, the subject was asked to step on the scale, follow a set of instructions on the screen that required data entry for height, weight, sex, and race, and once completed, gripped the handheld sensors and waited for a reading on the screen. Prior to using all of the machines, the subjects were asked to sit in a chair, remove their shoes and socks, and wipe their hands and feet down with an alcohol prep pad in order to clear the skin of any particles or oils that will interfere with the skin’s conductivity. A limitation of this method is a subject’s hydration status, as water in their bodies will be stored in the muscles, increasing the mass of the muscle perceived by the devices. Making sure subjects have the same levels of hydration and rest prior to separate tests will ensure results are within the proper range of each other.
Hydrostatic Weighing Protocol
The instrument used to calculate body density and body composition for the underwater weighing method was a hydrostatic weigh tank with a chair made of PVC piping tethered to a spring-loaded autopsy scale. This machine was connected to a computer which ran NEXYGEN DF software. This software provides basic force measurement of tensile and compressive test formats. Subjects that underwent the hydrostatic weighing experiment followed a strict protocol to ensure maximum accuracy. Subjects were asked to wear a tight-fitting bathing suit, remove all loose clothing and jewelry, and pull back hair if applicable. Prior to any underwater testing, subjects’ height and weight were collected. Using a spirometer, their vital capacities were tested and recorded. Once completed, the subject entered the tank and submerged their bodies, making sure to rid any air bubbles in the hair or within their bathing suits.
The subjects sat in the PVC seat that has been lowered into the water until their heads were slightly above the water. Subjects were asked to exhale a large portion of air from their lungs, while keeping their feet and arms compact and away from the pool bottom and sides. They were then asked to submerge their heads under the water, bringing their heads close to their knees. They were instructed to keep expelling air from their lungs and hold the position for at least three seconds, or long enough for the computer to give a stable reading. They were then signaled to come back to the surface. This final part of the protocol definitely takes the most getting used to, as subjects may have a fear they are drowning and if they do not keep still, the spring-loaded scale will not be able to compute a stable reading, giving them an inaccurate reading.
Once the underwater weighing segment of the test was complete and the values for body density were obtained, subjects calculated their residual volume using the equation RV = FVC * 0.24 for males and FVC * 0.28 for females. The values from the two tests were then plugged into the equation:
The programs used to collect, analyze, calculate, and organize data from the various experiments include Microsoft Excel, XLMiner Analysis ToolPak, and NEXYGEN DF.
Results
Body Composition Analysis Using Skinfolds, BIA, and Underwater Weighing
|
Subject Initials |
Skinfold BF% |
Omron BF% |
Tanita BF% |
Inbody BF% |
Underwater weighing BF% |
|
TD |
23.8% |
15.1% |
22.8% |
16.0% |
17.0% |
|
CE |
26.9% |
27.8% |
34.7% |
28.9% |
25.0% |
|
AA |
20.7% |
16.9% |
11.8% |
22.0% |
30.0% |
|
SF |
17.9% |
24.1% |
26.0% |
25.6% |
23.0% |
|
AR |
24.5% |
17.6% |
27.6% |
19.1% |
18.0% |
|
PV |
8.9% |
13.2% |
7.4% |
11.2% |
7.0% |
|
AP |
7.0% |
10.1% |
11.9% |
7.8% |
N/A |
|
MC |
6.9% |
N/A |
6.1% |
9.4% |
3.0% |
|
Total Average |
17.1% |
17.8% |
18.5% |
17.5% |
17.6% |
|
Female Average |
22.8% |
20.3% |
24.6% |
22.3% |
22.6% |
|
Male Average |
7.6% |
11.7% |
8.5% |
9.5% |
5.0% |
|
Standard Deviation (σ) |
8.29 |
6.16 |
10.59 |
7.75 |
9.70 |
|
Variance (σ2) |
68.8 |
38.0 |
112.2 |
60.0 |
94.0 |
Correlation Analysis
|
Correlation Coefficient (R-value) |
R2 Value |
Significance (p-value) |
|
|
Skinfold vs. UWW |
0.784 |
0.618 |
0.03626 |
|
Omron vs. UWW |
0.572 |
0.328 |
0.23489 |
|
Tinita vs. UWW |
0.586 |
0.343 |
0.16672 |
|
Inbody vs. UWW |
0.883 |
0.780 |
0.00837 |
Discussion
All correlation coefficients in the study reflect the comparison between each of the BIA methods and the skinfold technique and the Hydrostatic Weighing method. The standard deviation and variance values for each of the methods were higher than anticipated, however this could be due to the small sample size (N=8), which does not serve as a good representative for a large population. In a future study, collecting this data from more people of varying ages, ethnicities, and sexes will prove to be a more representative group. Nonetheless, the experiments performed still aligned with the current scientific literature. The skinfold method had a high correlation with the underwater weighing (R2 = 0.618), and this finding was significant (p = 0.03626). The Inbody test, however, had a higher correlation and a higher level of significance (R2 = 0.780, p = 0.00837).
The Omron and Tanita methods did not correlate as well with the underwater weighing method, as a comparatively lower correlation was found (R2 = 0.328 and R2 = 0.343 respectively) and there was no significance (p > 0.05). The Inbody proved my initial prediction that it would have the closest relationship to the gold standard method. The reason I suspected this to be true is because of the additional dimensions provided by a dual circuit using two hands and two feet, versus a single circuit using just the hands or feet alone. This method allows the machine to get a better overall representation of fat distribution across the body because the electrical current travels through the whole body. Therefore, this provides more accurate results when determining overall body composition.
Conclusion
Beyond use in a clinical or hospital setting, Inbody analyzers and other machines that utilize bioelectrical impedance technology may be found in gyms and health facilities where people can track and monitor their body composition. This benefits those who are seeking to reduce their risk of all cause mortality. Personal trainers may employ these methods to better assess a client and prescribe an appropriate exercise protocol. Keeping track of one’s own various dimensions of physical health may improve the quality of life in any person and may better equip them with the tools and knowledge to reduce their risk.
References
American College of Sports Medicine. 2018. ACSM’s Guidelines for Exercise Testing and
Prescription, 10th edition. D. Riebe, senior ed. Lippincott, Williams & Wilkins: New York.
Brooks, G.A., Fahey, T.D., White, T.P., Baldwin, K.M. 2000. Exercise Physiology: Human
Bioenergetics and its Applications, 3rd Edition. New York: McGraw Hill
Cappelli, L., & Seeley, A. (Spring 2019). Department of Kinesiology & Sport Sciences
Laboratory
Manual KIN 232. University of Miami.
Centers of Disease Control and Prevention. (2004). BMI – body mass index: Home.
Kahn, H.S., et al. (2014). Population Distribution of the Sagittal Abdominal Diameter (SAD)
from a Representative sample of US Adults: Comparison of SAD, Waist Circumference,
and Body Mass Index for Identifying Dysglemia. PLOS ONE. 9(10), e108707.
NAASO The Obesity Society. Obesity Online. Retrieved Feb 2, 2006.
www.obesityonline.org/slides/slide01.cfm?q=bmi&dpg=2
Siri WE. Body composition from fluid spaces and density. Univ Calif Donner Lab Med Phys
Rep, March 1956.


